GENETIC MAPPING AND KARYOTYPE GENOME SIZE
Oak mapping initiatives
European white oaks France
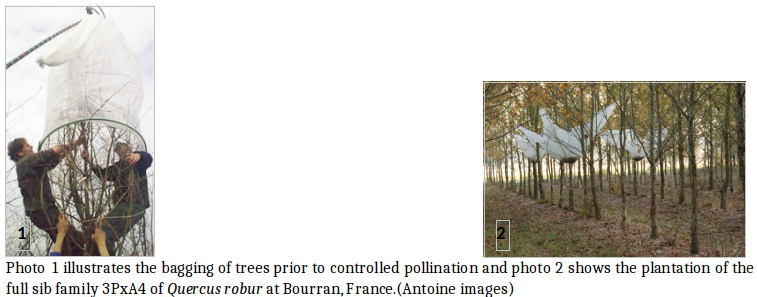
Starting in 1995, activities in genetic mapping were implemented in European white oaks at the INRA Research Centre in Bordeaux-Cestas (France). Motivations for genetic mapping in oaks were threefold (i) the detection of genomic regions involved in species differentiation, (ii) the detection of QTLs controlling traits of adaptive significance, (ii) the comparative analysis of genomic evolution in the Fagaceae. The whole mapping project is based on 4 pedigrees: one F1 full-sib family of Quercus robur (3PxA4), one F1 full-sib family of Q. petraea (QS28xQS21), and two interspecific F1 full-sib family Q. robur x Q. petraea (11PxQS29 and 11PxQS28). An interspecific F2 cross is currently being constructed as well. Given the objectives of the mapping experiments, the parents of the pedigrees were not selected for any particular criteria. The Q. robur parent trees originated from the Southwest of France (INRA research station of Bordeaux-Cestas, and Arcachon) and the Q. petraea parents were from the central part of France (INRA research station of Orléans-Ardon). The controlled crosses were repeatedly done over successive years until 2009. From 200 to 1000 seeds were obtained for each cross. The young seedlings were installed in a seedbed in a nursery where they are raised as stool-beds (Scotti-Saintagne et al., 2004). Starting at age 5, the full-sibs are hedged every year at the ground level at the end of winter time. Following the hedging, stump sprouts developing in spring were harvested and cut in 15 to 20 cm long cuttings. The cuttings were transferred in a greenhouse watered by a fog system for rooting. The rooted cuttings were then transplanted in the nursery where they were raised during one additional season. These cuttings were then transplanted in field tests for phenotypic observations and further QTL detection. The clonal tests of the full-sibs were planted in three different sites (2 near Bordeaux at Domaine INRA de Bourran in the South-West of France and one near Nancy at INRA Champenoux, Northeastern France). This experimental work, laborious and requiring a high expertise was implemented by two technicians, E. Bertocchi and G. Roussel and is now continued by B. Dencausse and the staff of UEFP (Unité Expérimentale Forêt Pierroton).
European white oaks Netherlands
Another mapping initiative for Q. robur was implemented in The Netherlands (ALTERRA research station, Wageningen, The Netherlands). This mapping pedigree (A1xA2) consists of 101 full-sibs (Bakker 2001). The sibs were screened by paternity analysis within an open pollinated progeny set of 397 sibs collected on a single tree located in an urban area (Amsterdam). This tree was surrounded by three other oak trees within a radius of 10 m. One of these oak trees was selected to be the paternal tree. Paternity analysis revealed that 26% of the collected seeds were sired by this male parent. The selected seeds were germinated, grown individually in pots in a nursery (ALTERRA research station, Wageningen, The Netherlands) and measured for several morphological and physiological traits during the next two years (1999, 2000). The objective of this work was quite similar to the French initiative: detection of QTL controlling morphological and adaptive traits involved in species differentiation.
European white oaks Germany
A third oak mapping initiative was implemented by the University of Göttingen in 2003 (Gailing, 2008; Gailing et al., 2008). A full-sib family of 387 plants (HSL03) was obtained after crossing two adult trees of Q. robur. In contrast to the ‘French’ cross, where both crossing parents originated from southwestern France, the crossing parents of the German mapping pedigree are from different geographic regions and subspecies. The female parent (accession EF03) is situated close to Escherode (Lower Saxony, 51º19 N, 9º40 E, altitude 380 m). The male parent (SL03, ssp. slavonica) is located in the Münsterland (Hamm-Westtünnen, North Rhine-Westphalia, Abt. 161A2, altitude 36 m). This tree is characterized as a Slavonian oak by its late bud burst (from 7 to 16 days later than the mean of neighboring indigenous oak trees), and its habitus (stem straightness, stronger growth compared to indigenous oaks at the same age). Slavonian pedunculate oaks in Münsterland are characterized by relatively large leaves and late bud burst compared to indigenous oaks, but also by accelerated growth, stem straightness and a long clear bole. According to historic documents, trees of the Slavonian stand in the Münsterland were established in 1888 from plant material harvested from the lowlands between the Rivers Save and Drava in Croatia. The seedlings of the cross were further planted in the field near the University of Göttingen in the fall of 2003, for future QTL detection (Gailing, 2008; Gailing et al.; 2008, Gailing et al.; 2013).
American red oaks USA
Genetic mapping in northern red oak (Quercus rubra L.) was initiated at Purdue University (Romero-Severson, 2003) and has continued at the University of Notre Dame. Using exclusion methods based on microsatellite polymorphisms (Aldrich et al., 2002, 2003a), a preliminary mapping population of 97 full-sibs was identified from the open pollinated progeny of a single tree. The most likely male parent male was the closest conspecific. Recombination patterns revealed six linkage groups of three or more markers. A second acorn harvest from the same female parent yielded 462 full-sibs. The genetic map under construction now includes 15 microsatellites, 66 AFLP markers from the first set of progeny and several hundred new AFLP markers from the second set of progeny. All of the potential pollen parents with 200 meters of the female parent are being genotyped with all fifteen microsatellite markers to eliminate any doubt over the full-sib status of the mapping population. The microsatellite markers used for genetic mapping are the same as those used for studies on interspecific gene flow (Aldrich et al. 2003b) and in northern red oak genetic diversity studies. No map has yet been published for Q. rubra. The long term goal of the red oak mapping project is the detection of QTLs and genes controlling heartwood color and resistance to specific pests, specifically Phytophthora ramorum, the agent of sudden oak death.
Genetic maps in European white oaks (Q. petraea and Q. robur)
A first generation of linkage maps were constructed using the two-way pseudo test-cross strategy (Grattapaglia and Sederoff 1994), using genetic arrays obtained by randomly distributed anonymous dominant markers (RAPDs or AFLPs), isozymes, and microsatellites.
The first Quercus map was published in 1998 on Quercus robur (Barreneche et al. 1998) (pedigree 3P x A4). Using the pseudo test-cross mapping strategy, two maps were constructed comprising 307 markers (271 RAPD, 10 SCARs, 18 SSRs, 1 minisatellite, 6 isozymes and 1 ribosomal DNA marker). Both maps provide 85 to 90 % coverage of the Q. robur genome. Segregating markers could be aligned in 12 linkage groups, and the map size amounted to 893.2 cM for the paternal and 921.7 cM for the female map. This map was further upgraded by the inclusion of new SSRs (Barreneche et al. 2004) and additional AFLP and STS. The upgrading is still ongoing and by 854 markers (271 RAPD, 457 AFLP, 10 SCAR, 59 SSR, 49 EST, 1 minisatellite, 6 isozymes and 1 ribosomal DNA marker) have been located The Dutch Q. robur map (pedigree A1 x A2) was also constructed using the two-way pseudo test-cross strategy (Bakker, 2001). Two parental maps were first established comprising 18 SSR and 343 AFLP markers. The total lengths of the maternal and paternal maps were respectively 496 and 566 cM. Thirteen linkage groups were obtained (for 12 chromosomes) and the two maps could be partially merged using 58 “bridge” markers (2 linkage groups could not be aligned). One of the paternal linkage groups (linkage group 13, 27 cM) was highly dissimilar to the other linkage groups in terms of marker density. This linkage group contained almost half (48%) of all paternal markers and 22% of the segregating (heterozygote) markers. This marker-dense linkage group was homologous to one of the maternal linkage groups that remarkably were composed exclusively of 13 segregating markers. The total map length of the integrated map was 659 cM map density was one marker per 2.40 cM for the map without taking the exceptionally dense linkage group 13 into account.
The German map of Q. robur based on 192 full sibs of the (EF03x SL03) pedigree was obtained by Gailing (2008). The construction was done with 162 AFLP markers segregating in a 1:1 ratio (92 markers from the female parent and 70 markers from the male parent) and 48 microsatellites. The resulting female map was composed of 74 markers (49 AFLPs and 25 SSRs); the male map consisted of 69 markers (48 AFLPs and 21 SSRs). Most linkage groups (apart from lg3m*, lg4m* and lg4f* that have no SSR markers) could be assigned to linkage groups of the 3PxA4 pedigree (French map). The 20 SSRs that are shared by both maps were used to align linkage groups of the male and female maps. The total length of the female map was 1135.3 cM, with an average marker distance of about 15.3 cM; the length of the male map was 938.8 cM, with an average marker spacing of about 13.6 cM.
Bodénès et al. (2012) established maps for Q. robur and Q. petraea by combining parental map datasets of SSR markers for each species using all the European white oak pedigrees (French, German and Dutch). They created a composite map of the different linkage groups sharing common markers. They used 573 EST-SSRs and 93 gSSR for the map construction. They assessed the heterogeneity of recombination rates between SSR marker pairs, and SSR markers with highly heterogeneous recombination rates. This work by Bodénès et al. (2012) presents a genetic map for two interfertile white oak species (Q. petraea and Q. robur), making it possible to trace chromosomal changes. The integrated species maps covered all 12 LGs, with a mean distance between markers of 2.60 cM for Q. robur and 2.91 cM for Q. petraea.
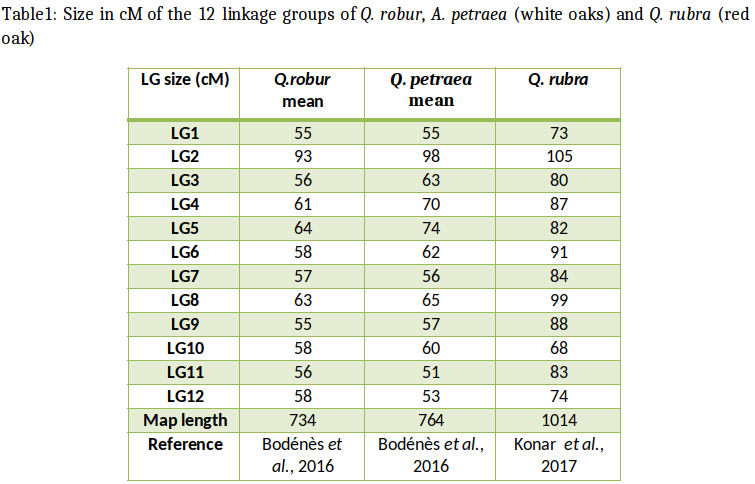
Bodénès et al. (2016) developed the densest single-nucleotide polymorphism (SNP)-based linkage genetic map to the date for the genus Quercus, by genotyping more than 1,000 full-sibs from two intraspecific (Q. robur: 3PxA4, Q. petraea: QS28xQS21) and two interspecific full-sib families of Q. petraea and Q. robur (11PxQS29 and 11PxQS28) by using an 8k gene-based SNP array (Lepoittevin et al., 2015). They constructed a single composite map by merging the eight parental maps. This map included 4,261 SNP markers spanning 742 cM over the 12 linkage groups (LGs) of the oak genome. Overall, 82% of the SNPs successfully genotyped were polymorphic in at least one of the four pedigrees and 63% were mapped as FMs on the parental genetic maps.
This oak map can provide a framework for genome-wide analysis at the centimorgan scale, for studies of the evolutionary relationships between related species, genomic scans of species/population divergence, and positional characterization of QTLs through co-localization with gene-based markers and the identification of chromosomal rearrangements (Bodénès et al., 2016).
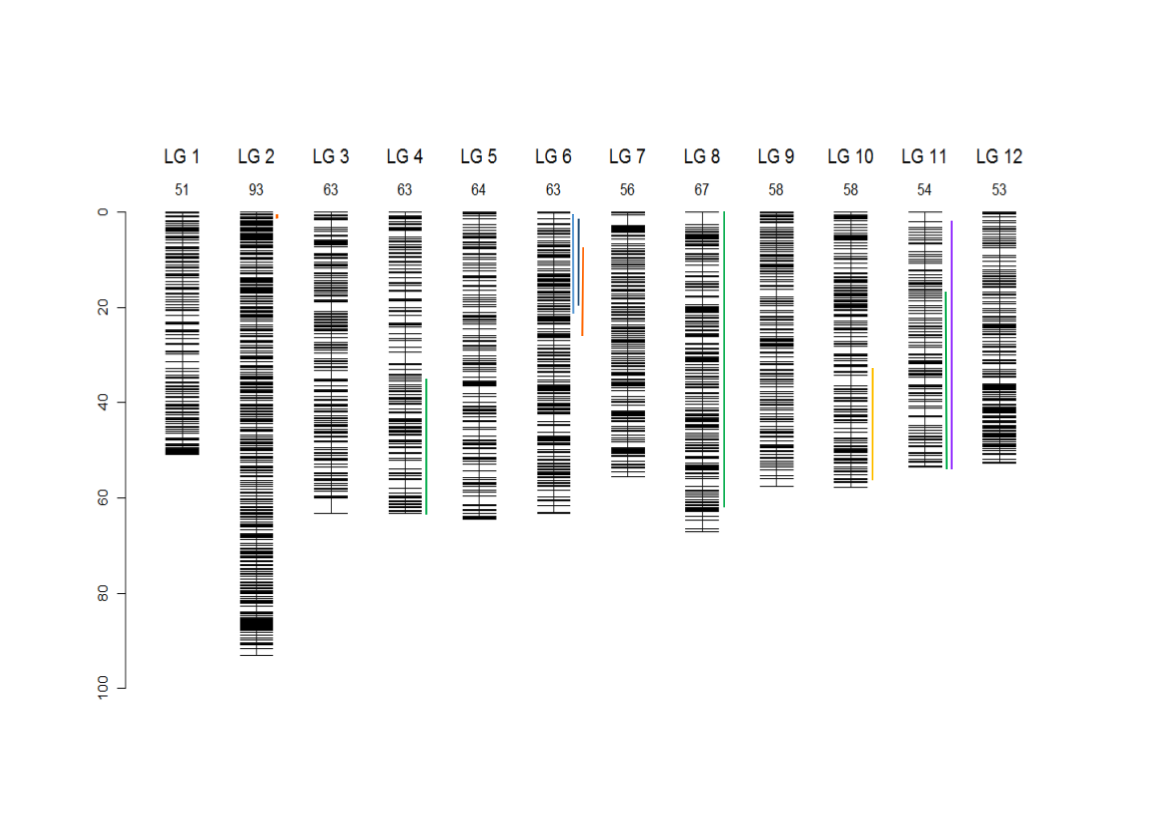
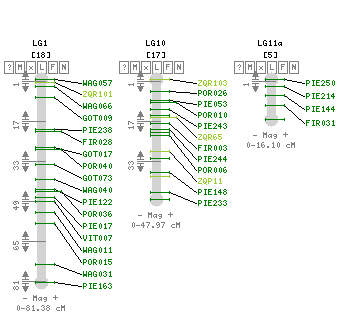
Composite linkage map for the 12 LGs and localization of the 9 segregation distorted regions (SDRs). The SDRs are represented by a vertical colour trait along the LG2 (in orange: P1f, LG4, in dark green: P2m, LG6, left to right, in light blue: P4f, dark blue: P4m, orange: P1f, LG8, in dark green: P2m, LG10, in yellow: P1m, LG11, in dark green: P2m, in violet: P3m). The LG size in cM is given in the LG name (Bodénès et al., 2016).
Genetic maps in northern red oak Q. rubra
Konar et al. (2017) generated a statistically robust framework map for Quercus rubra, with gSSR and EST-SSR markers, and then using ddRADseq to discover SNP markers for the same individuals. This approach to mapping with ddRADseq included a F1 full-sib population from one seed parent and one pollen parent, producing a high sequencing depth in the parents (248×) and a moderate sequencing depth (15×) in the progeny. Using ddRADseq in combination with an SSR-based framework map, they constructed an oak genetic map that will enable testing of explicit hypotheses about the organization of loci contributing to adaptive evolution in oaks and, provide a tool for the detection of allelic variants contributing to stress tolerance.
The ddRADseq technology can produced enough high-quality SNP markers to make moderately dense, high-quality maps. This ddRADseq approach inexpensively generates tens of thousands of SNP calls, a seemingly sufficient number for detecting fine-scale population substructure, constructing phylogenies, and generating densely populated genetic maps.
The generation of a moderately dense genetic map in Q. rubra complements the dense map produced for the European oaks Q. robur and Q. petraea, confirms synteny and provides evidence of high collinearity across two genetically incompatible sections of the Quercus genus. (Konar et al., 2017).
Comparative mapping in the Fagaceae
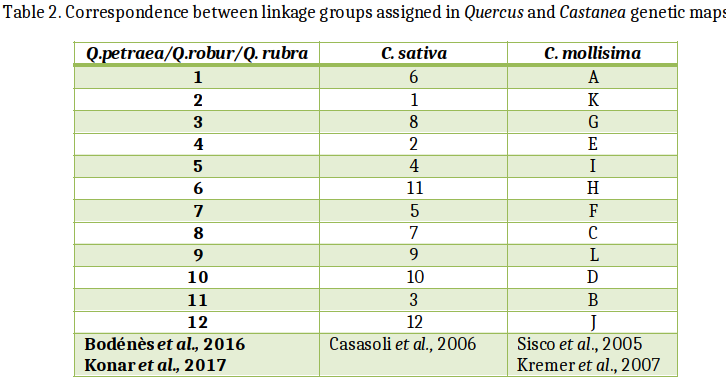
In the Fagaceae (oaks, chestnuts, and beeches), genetic maps are reported for pedunculate oak (Quercus robur), sessile oak (Q. petraea), F1 hybrids of Q. robur x and Q. petraea,, northern red oak (Q. rubra) European chestnut (Castanea sativa), Chinese chestnut (C. mollissima), the interspecific cross of Chinese chestnut x American chestnut (C. dentata) and European beech (Fagus sylvatica, Scalfi et al., 2004). Comparisons between the different maps have been made between Quercus and Castanea and are reported here. The comparative analysis of these maps across phylogenetically related species are based on the development of transferable and orthologous genetic makers.
In 1997, Steinkellner et al. showed that microsatellite markers specifically developed in Quercus species could be cross-amplified in European chestnut (Castanea sativa). Hence microsatellites were considered as useful molecular markers for comparing Q. robur and C. sativa genetic linkage maps. In order to obtain orthologous markers for comparative mapping, SSR markers developed both in Quercus species and in C. sativa were therefore tested for cross-amplification and transferability between these two genera (Barreneche et al., 2004 and therein references) in a reciprocal way. Fifty three microsatellites developed in Quercus species and 30 in C. sativa were reciprocally tested on the two species. Nineteen loci, 15 from oak and 4 from chestnut, were integrated into the two previously established genetic maps allowing a first comparative mapping between linkage groups of the two species (Barreneche et al., 2004).
Homologous linkage groups identified by orthologous SSR could be assigned between the two existing genetic maps (Barreneche et al., 1998 for Q. robur; Casasoli et al., 2001 for C. sativa).
These efforts were further extended to compare genetic linkage map of Q. robur and C. sativa with the C. mollissima x C. dentata, which is the north American pedigree used for mapping in American chestnut (Sisco et al., 2005).
Overall, these findings showed that microsatellite markers can be cross-transferred between Quercus and Castanea genera and can be used to recover orthologous markers for comparative mapping. SSR loci were extremely useful for comparative mapping within the same genus (Castanea) but their cross-transferability efficiency decreased between different genera (Fagus and Nothafagus for exemple, Bodénès et al., 2012). SSR loci mapped both in Q. robur and C. sativa were sequenced in order to definitely demonstrate their orthology. Sequencing results clearly showed that both orthologous and paralogous loci could be recovered among the SSR cross-transferred between the two genera. Moreover, indels were sometimes observed within the flanking regions of the repeated motif. Therefore, although SSR loci can be cross-transferred between Quercus and Castanea genera, a sequence analysis is needed to demonstrate orthology and to avoid the risk of paralogy. At this stage the transferability of SSR between Quercus and Castanea allowed to assign linkage groups but was not sufficient to conclude on synteny or collinearity of the linkage groups (Kremer et al., 2007). Similar attempts were also conducted to extend the comparison of genetic maps with Fagus. However the transferability rate of SSR was too low to allow assignment of linkage groups.
Several linkage maps have been generated in the last few years for oaks (Quercus), beeches (Fagus), and chestnuts (Castanea). They support forward genetic approaches for studying the genetic architecture of adaptive traits (number, location and effect of QTLs) and the structural features of the oak genome and its evolutionary history. A limited number of genomic SSRs (approximately 50) and EST-based (approximately 50) marker have also been added to these maps (Barreneche et al., 2004; Casasoli et al., 2004; 2006). These markers allowed to align homologous linkage groups between oak and chestnut and to compare and validate the QTLs that had been previously characterized in Bodénès et al. (2012) evaluated the transferability of EST-SSR markers to other Fagaceae species, by carrying out cross-species amplification in six species (Castanea sativa, Fagus sylvatica, Quercus faginea, Quercus pyrenaica, Quercus ilex, and Quercus suber). SSR amplification and genotyping were performed with a subset of 243 EST SSRs randomly selected. The selected microsatellite markers included 137 di-, 90 tri-, 2 tetra-, 1 penta- and 13 hexanucleotide repeats. The consensus map was constructed by joining the 10 independent parental maps based on the mapping populations in which EST-SSRs and SNP-based markers were mapped.
A comparison of the consensus maps of Quercus and Castanea revealed a high degree of collinearity and synteny between the 12 homologous linkage groups, despite the divergence of their lineages 70 million years ago (Bodénès et al., 2012).
Karyotype and Genome size
Although a few cases of natural occurring triploids have been mentioned in the literature (Butorina, 1993; Naujoks et al., 1995; Dzialuk et al., 2007), oaks are diploid species bearing 2n=24 chromosomes. Extra chromosome 2n=24+1,2 or 3 extra chromosomes have been reported as consequences of irregular segregation in mitoses (Zoldos et al., 1998). Reported karyotype studies in Quercus, Lithocarpus, Castanopsis and Castanea (Mehra et al. 1972), and in Quercus (D’Emerico et al. 1995), and in Fagus (Ohri and Ahuja 1990, 1991) indicate that the number of chromosomes within the Fagaceae family as a whole is remarkably stable (2n=24).
The reported values of 2C DNA content between oak species vary from 1.17pg (Q. velutina) to 2.00 pg (Q. coccifera and Q. suber). Species that were investigated include representatives of all three major sections (12 species in Erythrobalanus (red oaks), 12 species in Lepidobalanus (white oaks), 4 species in Cerris). The average 2C DNA contents were 1.81pg for section in Cerris, 1.75pg for section in Lepidobalanus, and 1.56pg for section in Erythrobalanus (Kremer et al., 2007, and table attached). The two oaks species with largest genomes, Q. coccifera and Q. ilex (2.00pg), are both evergreen species and are part of a disputed botanical group (subgenus named Sclerophyllodrys, according to Schwarz et al., 1964) being in two different sections in Camus classification (Q. ilex in section Lepidobablanus and Q. coccifera in section Cerris). This is intriguing, given that molecular phylogenetic analysis separates the evergreen species from the two sections of deciduous oaks (Manos and Steele 1997 and Xu 2004) confirming their earlier subdivision in Sclerophyllodrys by Schwarz (1964). 2C DNA values in related genera are at the lower limits of the range of values observed in oaks: 1.62pg for Castanea and 1.17pg for Fagus.